Monitor - Grafana (Loki), Elastic and Raygun
Grafana / Loki / Promtail
For help and support, try the Grafana Labs Community Forum
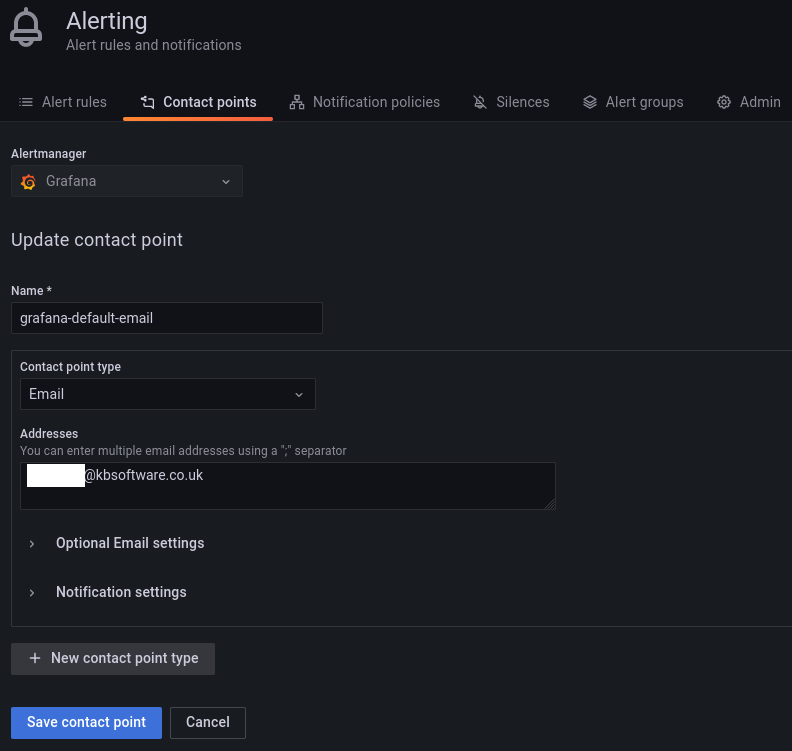
Grafana
Alerting, Contact points, edit grafana-default-email e.g.
Promtail
To add logging to a server, add config.promtail to the top.sls file in
the pillar e.g:
base:
  '*':
    - global.users
'server':
  - config.promtail
  - config.search
  - config.workflow
Where config.promtail contains the IP address of the Loki host e.g:
promtail:
  loki_host: 10.10.2.41
To check the status of the Promtail service on a server:
journalctl -u promtail.service -f
Raygun
In settings/production.py:
# raygun middleware added in ``production.py``
# See note dated 12/02/2021 on
# https://www.kbsoftware.co.uk/crm/ticket/124/
MIDDLEWARE = ("raygun4py.middleware.django.Provider",) + MIDDLEWARE

RAYGUN4PY_CONFIG = {
    "api_key": get_env_variable("RAYGUN4PY_API_KEY"),
    "ignored_exceptions": ["EmptyPage", "Http404", "PermissionDenied"],
    "transmit_environment_variables": False,
}
To get the name of the exception to add to ignored_exceptions
e.g. for EmptyPage:
django-admin.py shell                                                                                                                       07:44:28
>>> from django.core.paginator import EmptyPage
>>> EmptyPage.__name__
'EmptyPage'
In settings/base.py (just a comment):
MIDDLEWARE = (
    # raygun middleware added in ``production.py``
    # See note dated 12/02/2021 on
    # https://www.kbsoftware.co.uk/crm/ticket/124/
    # "raygun4py.middleware.django.Provider",
In .env.fish:
set -x RAYGUN4PY_API_KEY "my-raygun-api-key"
In .gitlab-ci.yml`:
test:
  script:
  - export RAYGUN4PY_API_KEY="my-raygun-api-key"
Testing
www.hatherleigh.info.sh shell
>>> from raygun4py.cli import send_test_exception
>>> from django.conf import settings
>>> send_test_exception(settings.RAYGUN4PY_CONFIG["api_key"])
Elastic - Hosted Server
Tip
I think we need to install X-Pack to get the APM dashboards. (from elastic, Doubling Down on Open, X-Pack features - … dedicated APM UIs)
30/12/2020 We are using the Elastic hosted service, so no need to setup a server (for now).
Connectors
To configure Sparkpost:
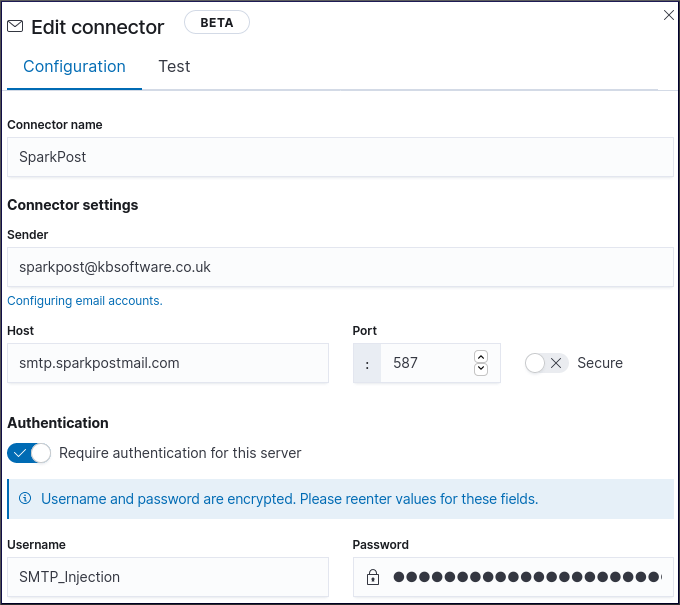
Tip
For more information, see https://www.sparkpost.com/blog/setup-sparkpost-smtp-relay/
Server Configuration
To create a server acting as a monitor using Elastic APM, add the following
to the top.sls file of your pillar:
base:
  '*':
    - global.users
  'elastic-*':
    - config.firewall.monitor
    - config.kibana
    - config.search
Tip
My monitor servers all start with a hostname of elastic-.
config/kibana.sls:
kibana:
  True
config/search.sls:
search:
  True
config/firewall/monitor.sls:
firewall:
  monitor:
    # My server
    - 55.144.55.144
    # My other server
    - 133.55.133.55
Re-start services (it might be a good idea to tail the log files first):
service elasticsearch restart
service kibana restart
service apm-server restart
Check the log files:
tail -f /var/log/syslog
tail -f /var/log/elasticsearch/elasticsearch.log
tail -f /var/log/apm-server/apm-server
Warning
If you re-start apm-server, the log file will be re-created,
so you will need to re-start the tail.
Tips
To run the APM server in the foreground:
service apm-server stop
apm-server -e
To view the web interface of the monitor server on your workstation:
ssh -N -L 8888:localhost:5601 monitor.yourbiz.co.uk
Note
This command tunnels the HTTP service from port 5601 on the monitor server (Kibana) to your local workstation on port 8888.
Browse to: http://localhost:8888/ to view the dashboards.
To make this easier, add the following to ~/.ssh/config:
Host elasticapm
    Hostname monitor.yourbiz.co.uk
    LocalForward 8888 localhost:5601
Now you can type ssh -N elasticapm to run it in the foreground and
ssh -f -N elasticapm to run it in the background.
You could then add the following to your ~/.bashrc which means that the
monitoring is available when you turn on your computer
(it’s wrapped in an if statement so the ssh tunnel is only set up the first
time the bash startup file is executed):
if [ "$(ss --listen | grep 8888 | head -n 1)" = "" ]; then
    ssh -f -N elasticapm
fi
Site Configuration
Add the following to requirements/base.txt:
elastic-apm==
Tip
See Requirements for the current version.
In settings/base.py:
MIDDLEWARE = (
    'elasticapm.contrib.django.middleware.TracingMiddleware',

THIRD_PARTY_APPS = (
    'elasticapm.contrib.django',
Note
Make sure that TracingMiddleware is the first MIDDLEWARE in
the list.
In settings/base.py, add the following to LOGGING
(Elastic APM and Django Logging):
"handlers": {
    "elasticapm": {
        "level": "WARNING",
        "class": "elasticapm.contrib.django.handlers.LoggingHandler",
    },

"loggers": {
    # Log errors from the Elastic APM module to the console (recommended)
    "elasticapm.errors": {
        "level": "ERROR",
        "handlers": ["console", "logfile"],
        "propagate": False,
    },
In settings/local.py:
ELASTIC_APM = {"DISABLE_SEND": True}
In settings/production.py:
DOMAIN = get_env_variable('DOMAIN')
DATABASE = DOMAIN.replace('.', '_').replace('-', '_')

ELASTIC_APM = {
    "DISABLE_SEND": get_env_variable_bool("MONITOR_DISABLE_SEND"),
    "SECRET_TOKEN": get_env_variable("MONITOR_SECRET_TOKEN"),
    "SERVER_URL": get_env_variable("MONITOR_SERVER_URL"),
    "SERVICE_NAME": DATABASE_NAME,
}
Note
Refer to your company Checklist and replace
monitor.yourbiz.co.uk with the name of your server.
Note
DOMAIN and DATABASE should already exist in production.py.
Deploy
Find the external IP address of your workstation:
dig +short myip.opendns.com @resolver1.opendns.com
Add it to config/firewall/monitor.sls in your pillar e.g:
firewall:
  monitor:
    # web server
    - 13.16.24.14
    # yourbiz
    - 91.85.167.37
Tip
Please add a comment to show which server / workstation has the IP address.
Copy the pillar to your Salt master and run a state.apply to update the
firewall on your monitor server e.g:
salt 'elastic-monitor' state.apply --state-verbose=False
Check you have included config/monitor.sls in your pillar e.g:
monitor:
  server_url: http://monitor.yourbiz.co.uk:8200
To check your configuration, run:
python manage.py elasticapm check
To send a test exception using the current settings, run:
python manage.py elasticapm test
To disable monitoring for your test (or temporary) site:
# sites/my.sls
sites:
  hatherleigh_info:
    monitor: False
Curator
Delete / clean APM monitor indexes…
Install:
wget -qO - https://packages.elastic.co/GPG-KEY-elasticsearch | sudo apt-key add -

# update
# /etc/apt/sources.list.d/curator.list
# and add
deb [arch=amd64] https://packages.elastic.co/curator/5/debian9 stable main

apt update
apt install elasticsearch-curator
List apm indexes:
curator_cli --host localhost show_indices --filter_list '[{"filtertype":"pattern","kind":"prefix","value":"apm-"}]'
Clean indexes older than 60 days:
curator_cli --host localhost delete_indices --filter_list '[{"filtertype":"pattern","kind":"prefix","value":"apm-7.2.0-"}, {"filtertype":"age","source":"name","timestring":"%Y.%m.%d","unit":"days","unit_count":1,"direction":"older"}]'
Tip
Update the value to match the indexes you want to delete.
Uptime Kuma
Uptime Kuma is an easy-to-use self-hosted monitoring tool. https://github.com/louislam/uptime-kuma
Usage notes: https://chat.kbsoftware.co.uk/kb/pl/akrzerrubprcbda3km9dckjy3w